
Program Office Support Tool
A powerful tool that allows opening an ACE session from within Microsoft Excel
Provides key functionality for reporting, what-if excursions, and presentation development.
Enables people unfamiliar with ACE to run ACE-hosted models from a familiar application
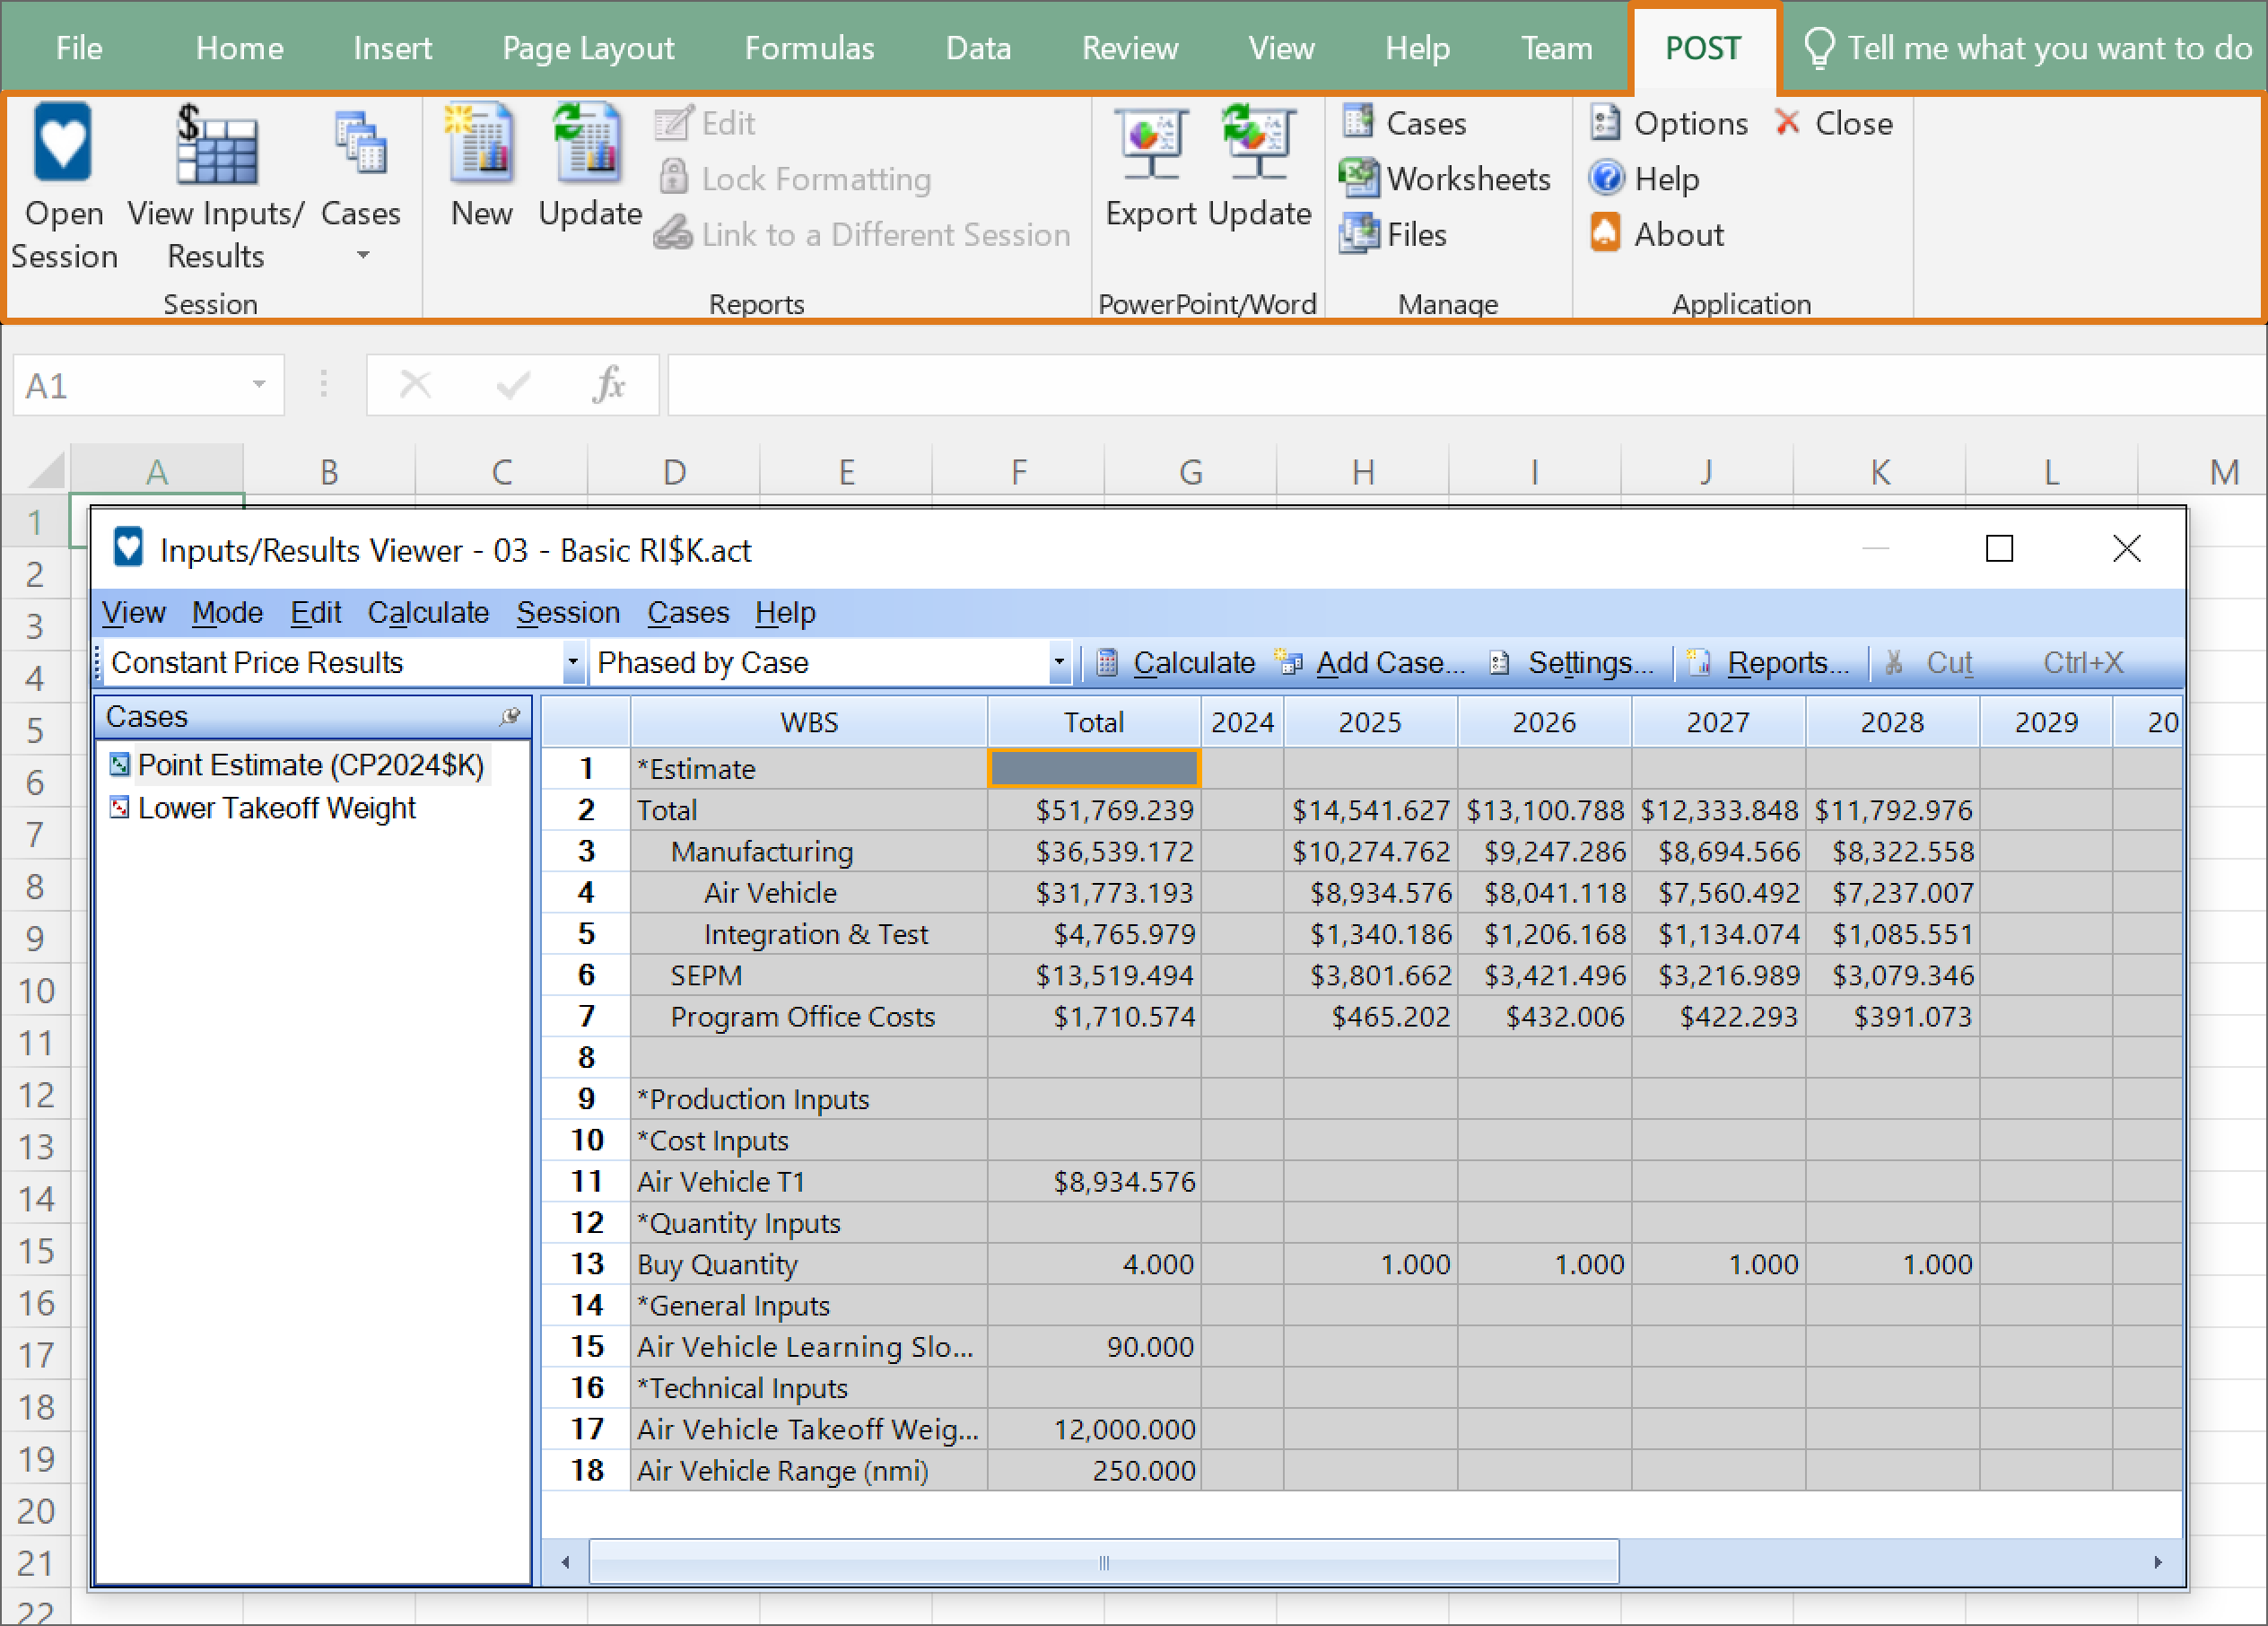
Session Viewer Features:
- View inputs, create overrides and calculate results without needing to open ACE
- View ACE models, create new cases and even run simulations all within Excel
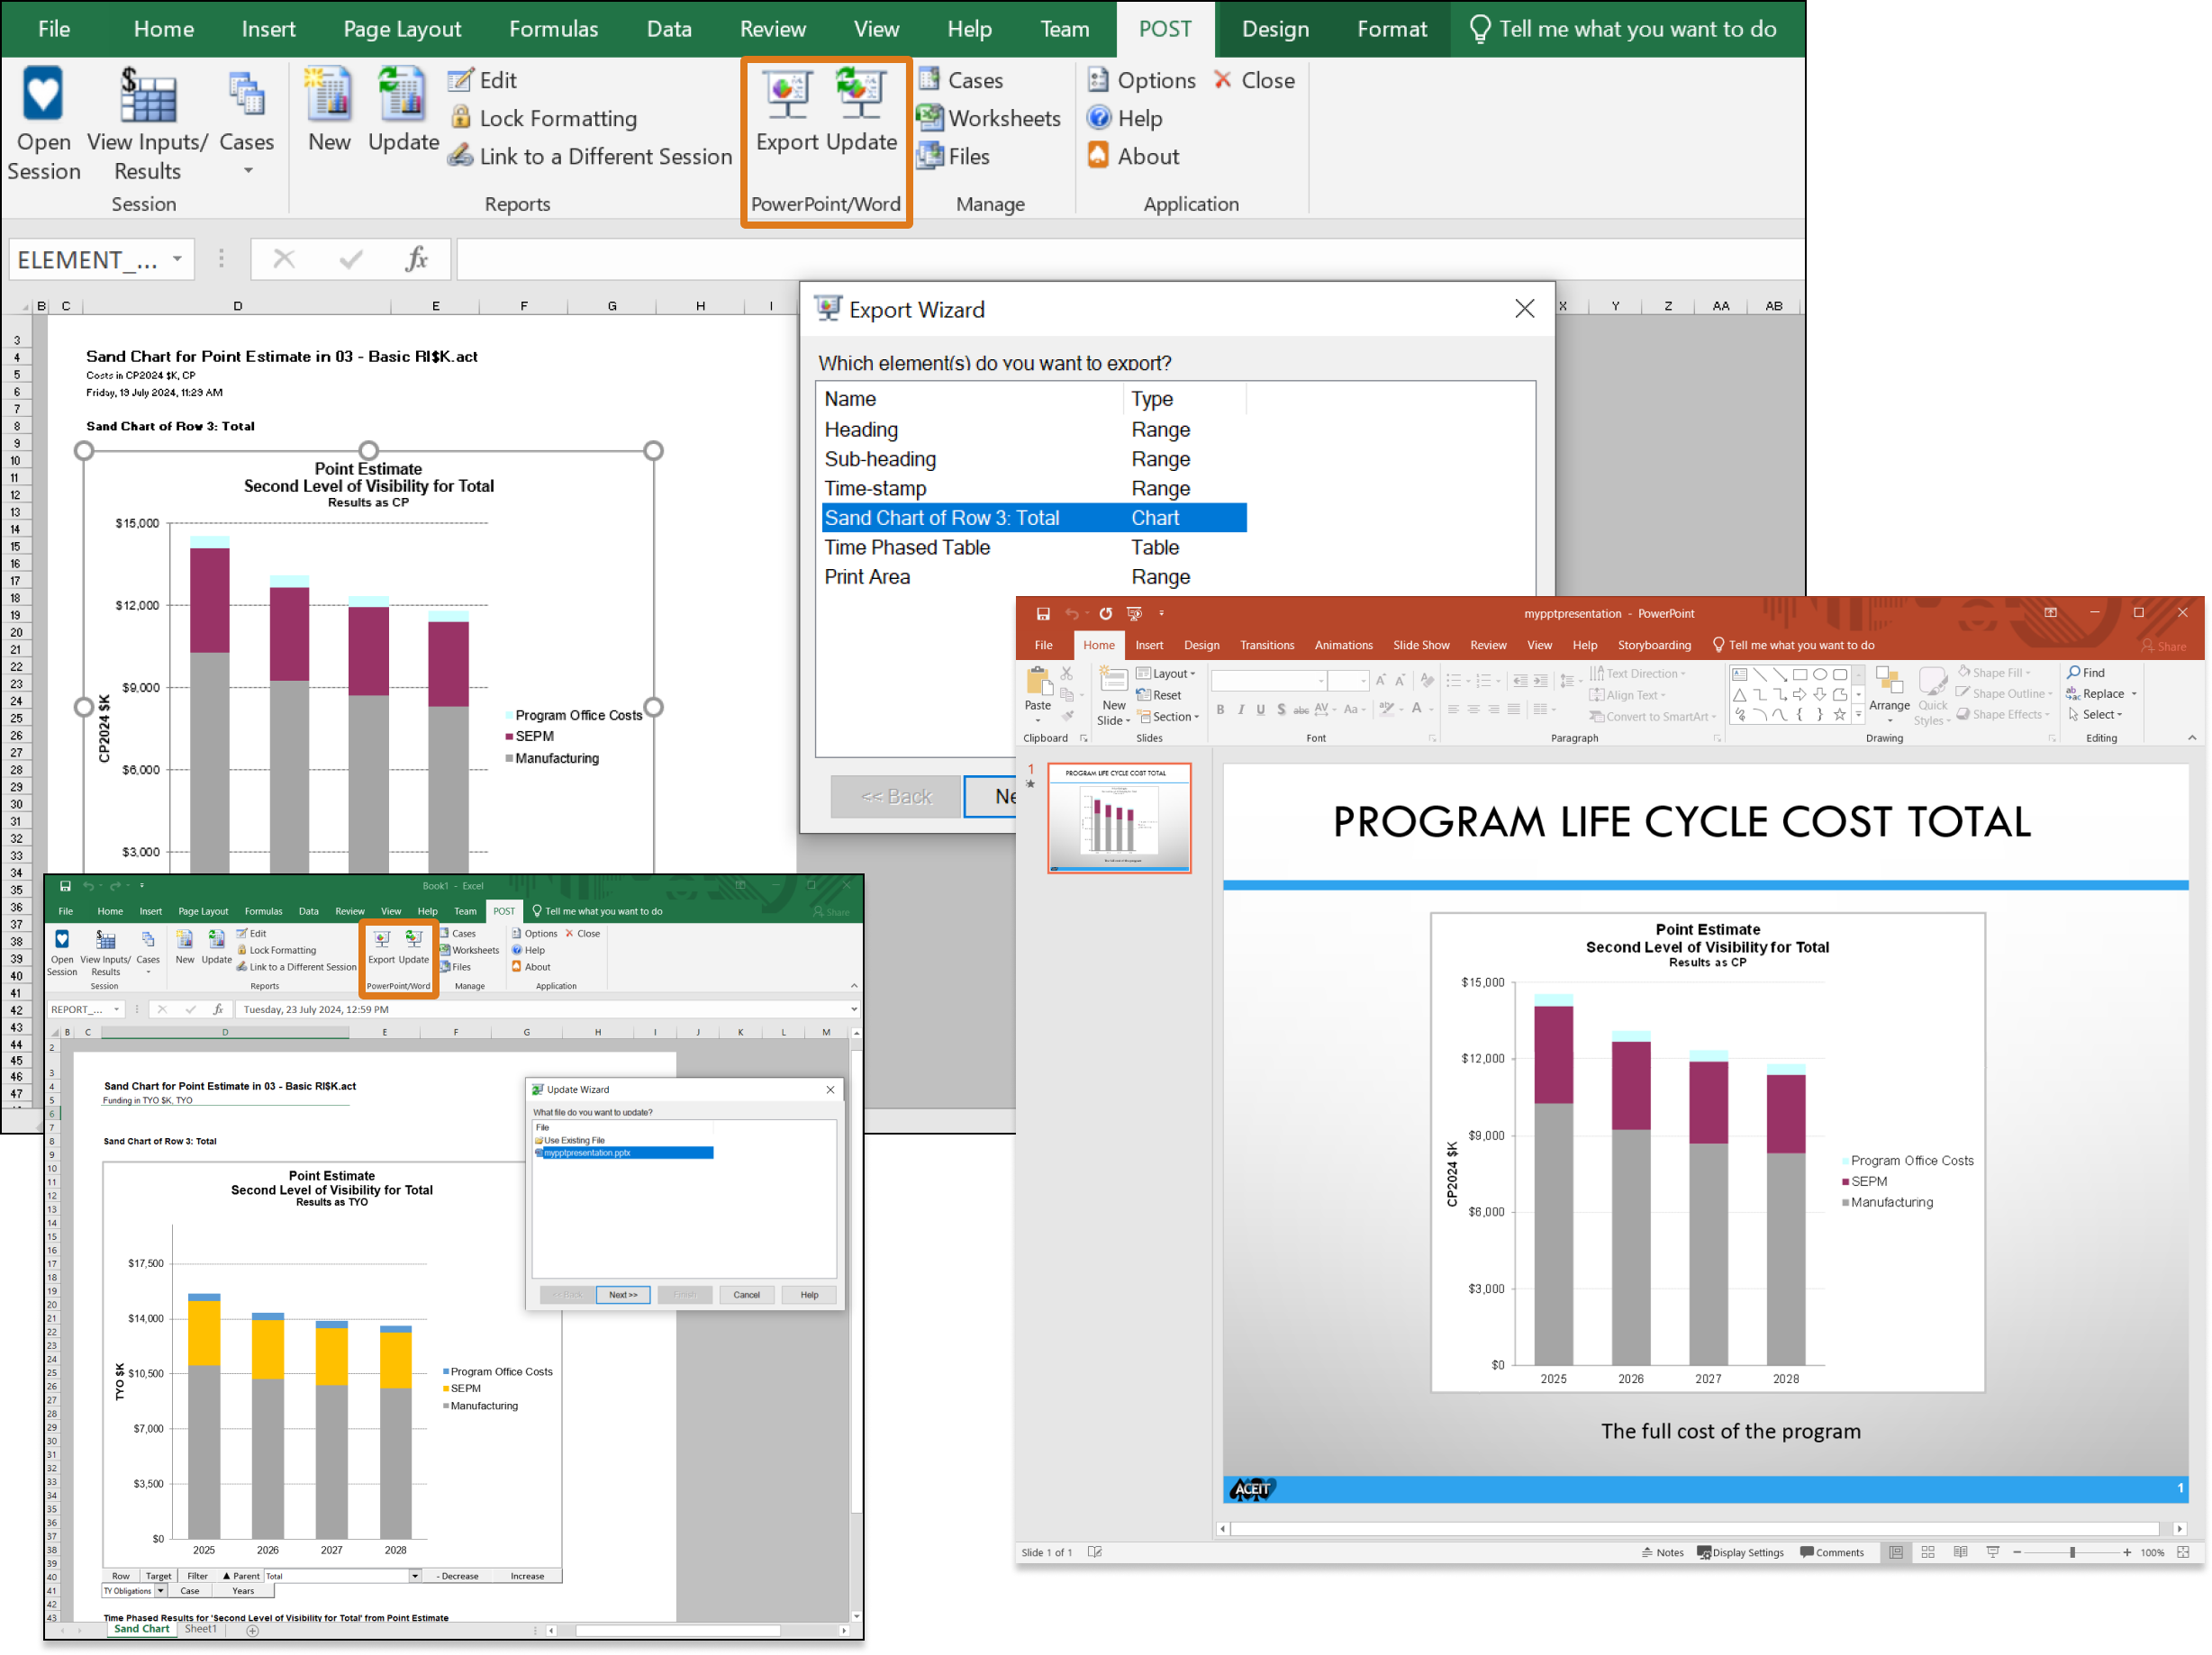
Import/Export Features:
- Easily export all your charts from Excel into PowerPoint or Word
- Update every chart in your presentation instantly
×
![]()
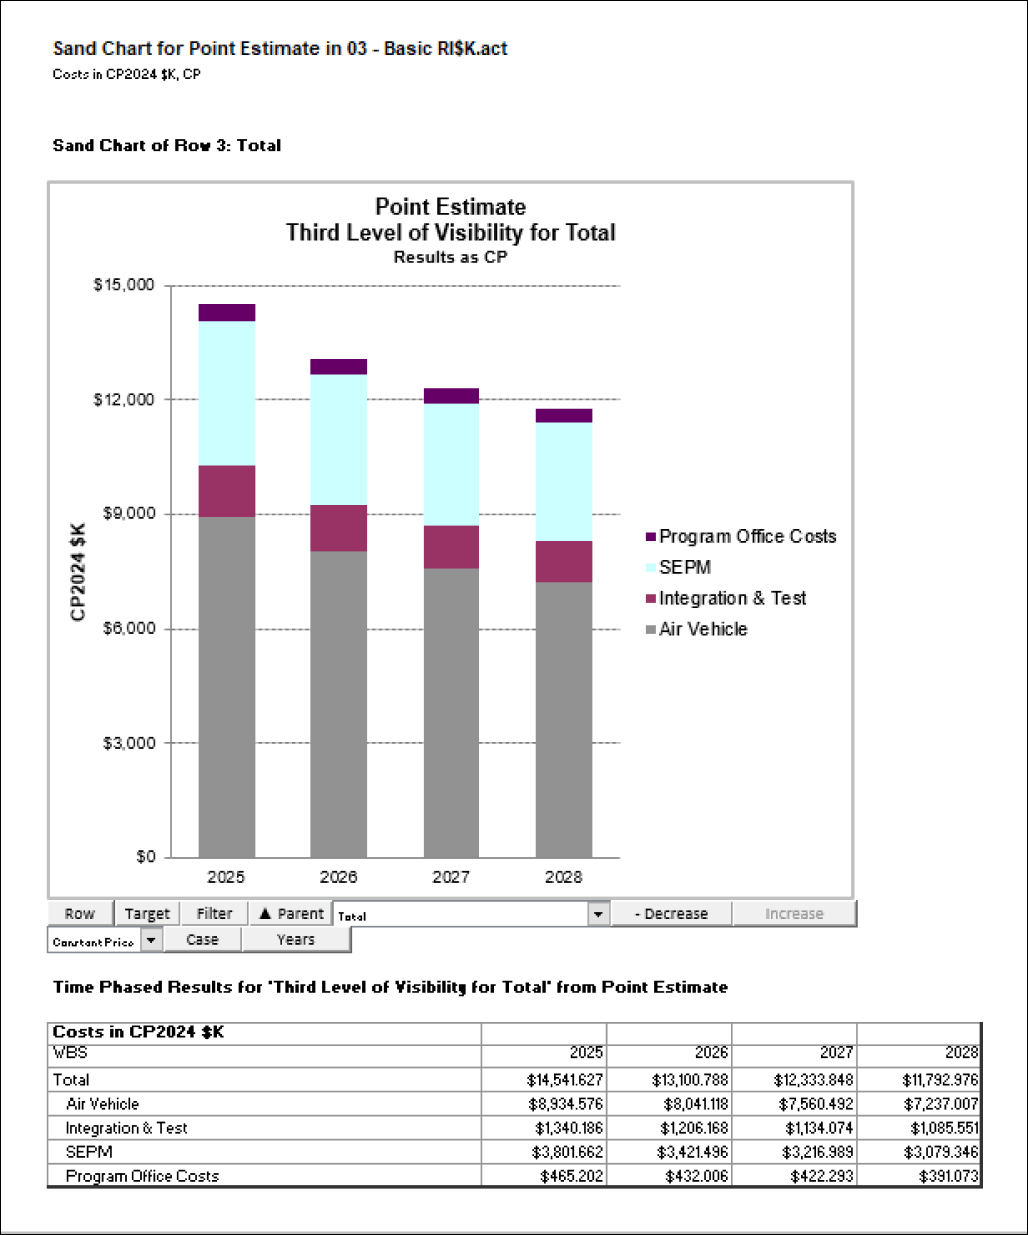
Quickly create a wide array of tabular reports and graphical charts within Excel
Different views of all your point estimates

Example Sand Chart:
- Stacked annual total costs displayed by fiscal year
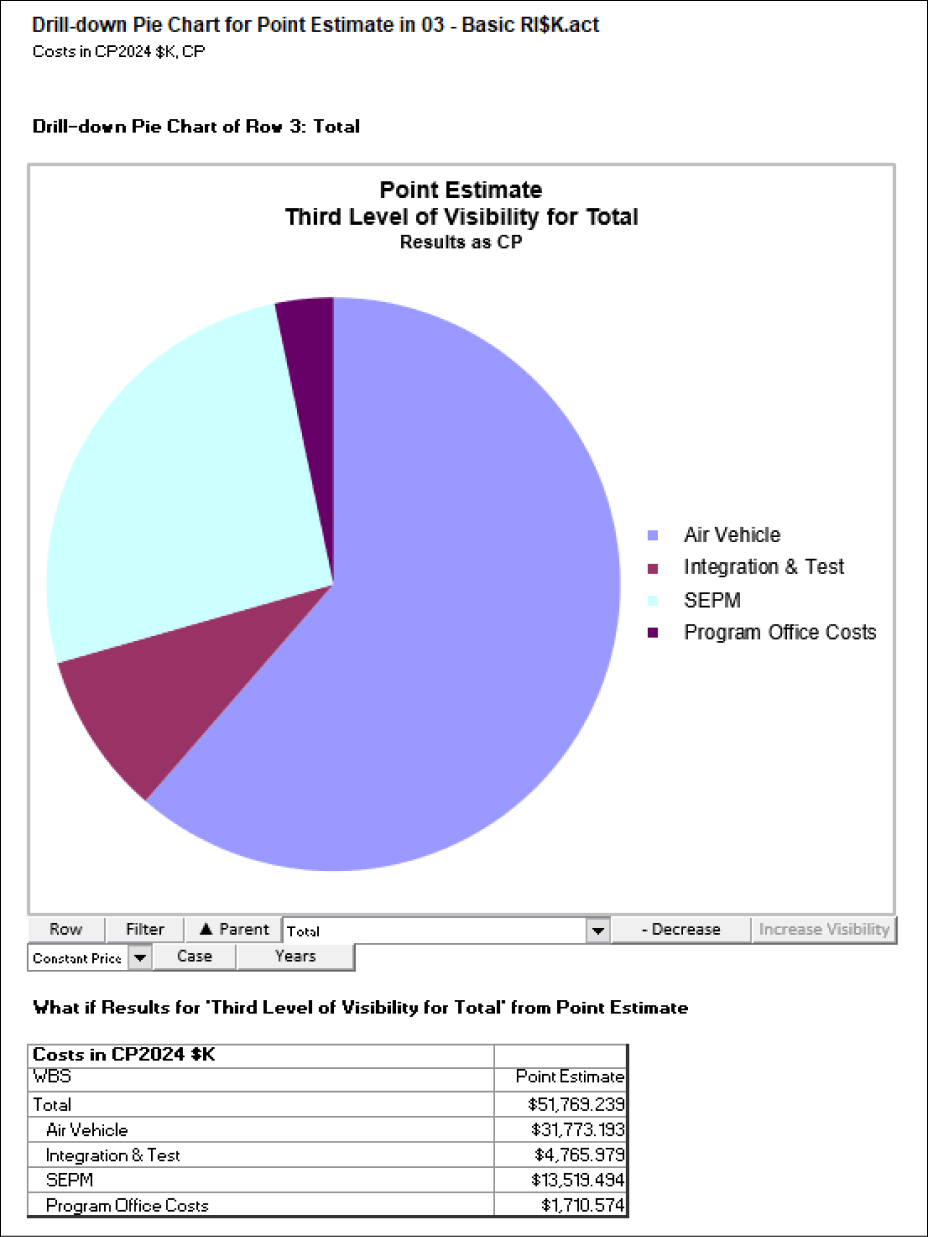
Example Drill-Down Pie Chart:
- A total cost split into children costs at a chosen WBS level
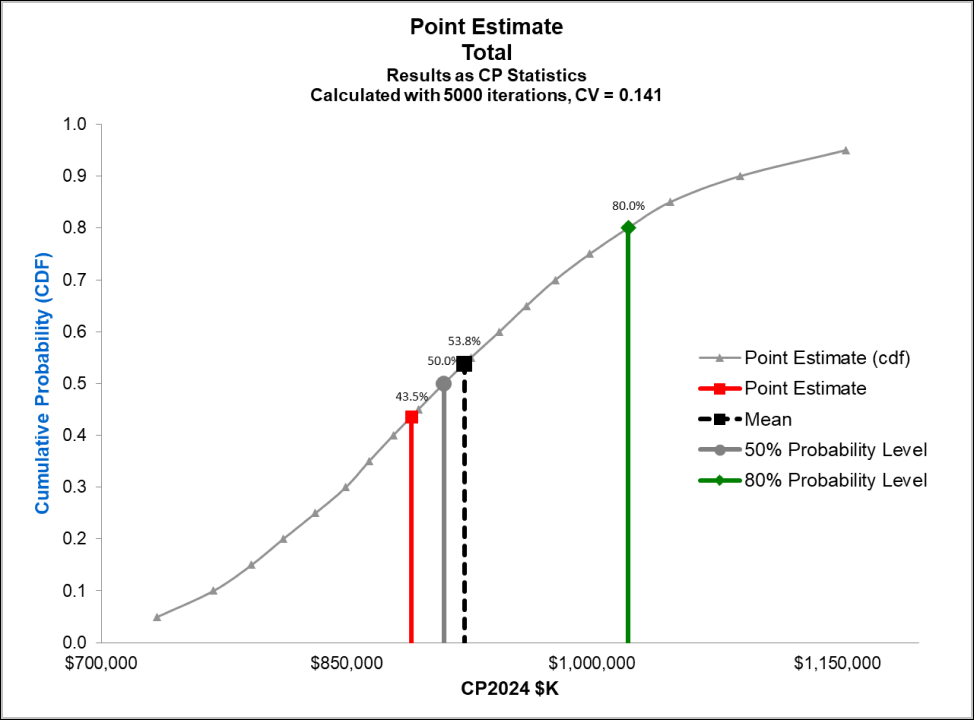
A variety of methods to understand the uncertainty in your model
Example RI$K Chart:
- S-Curve with markers at specified probability levels
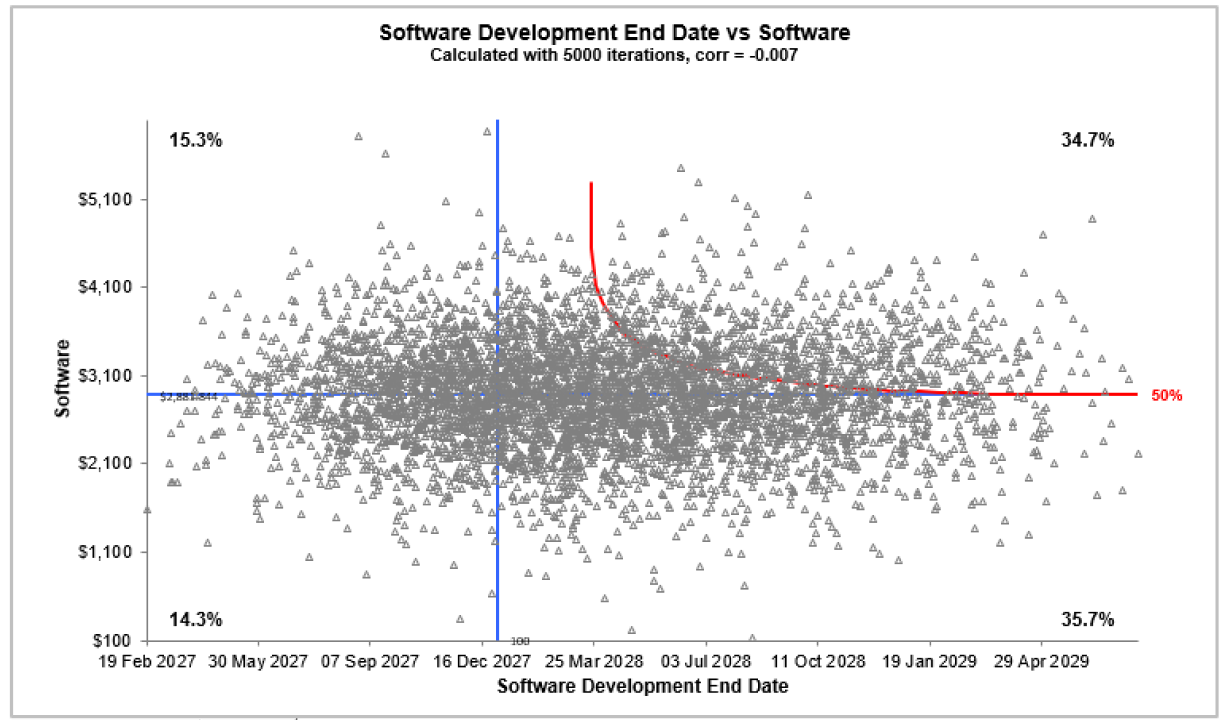
Example Joint Probability Plot:
- Each iteration of two uncertain elements plotted against each other
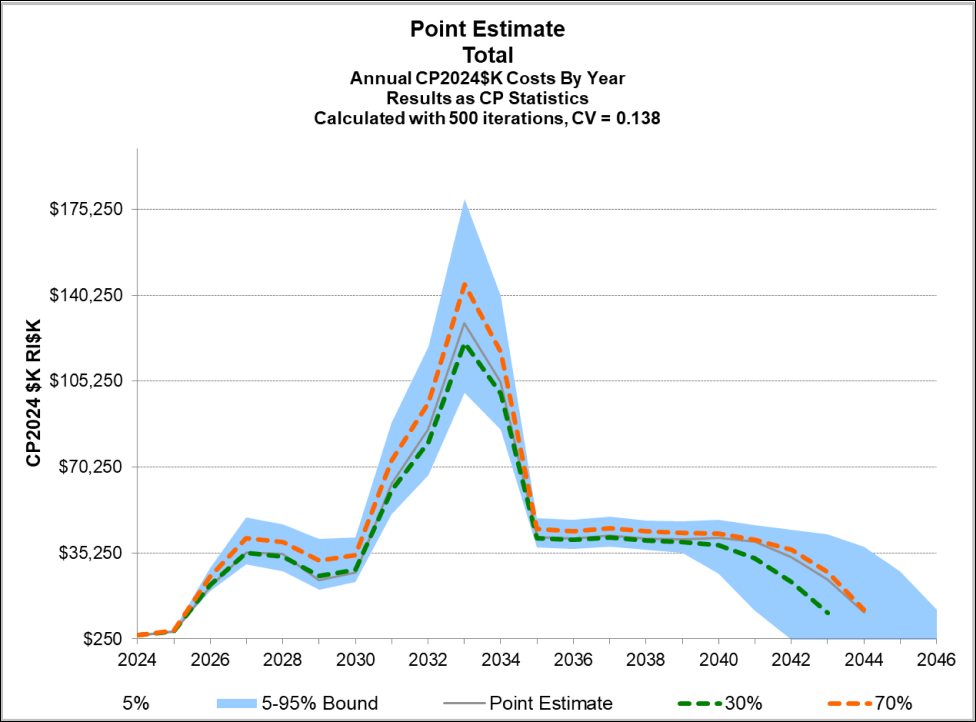
Example Fan Chart:
- Specifed ranges of uncertainty plotted by fiscal year
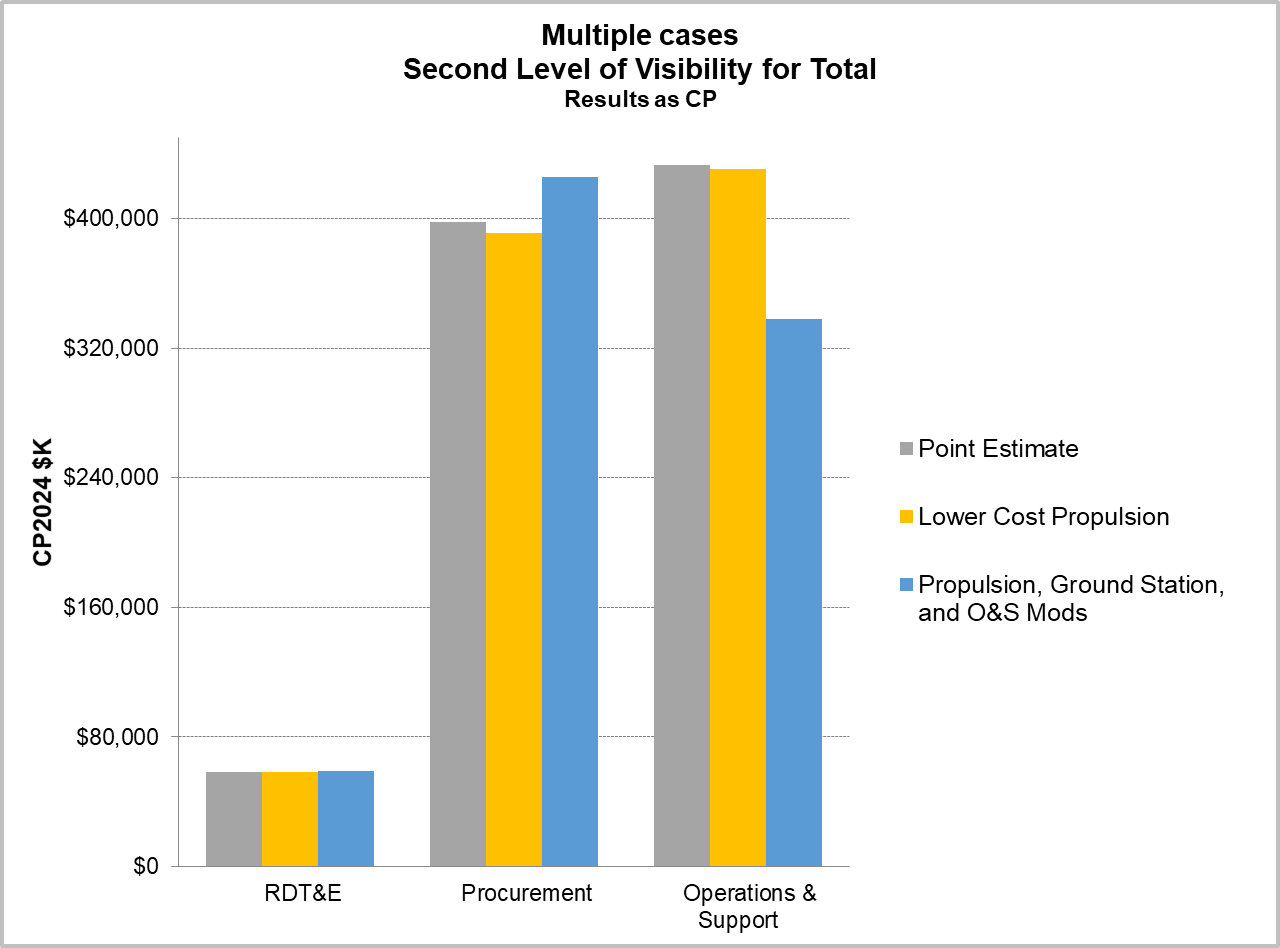
Compare results between rows, across cases and over years
Example Drill-Down Chart:
- Tabular report highlighting differences in the model across various cases
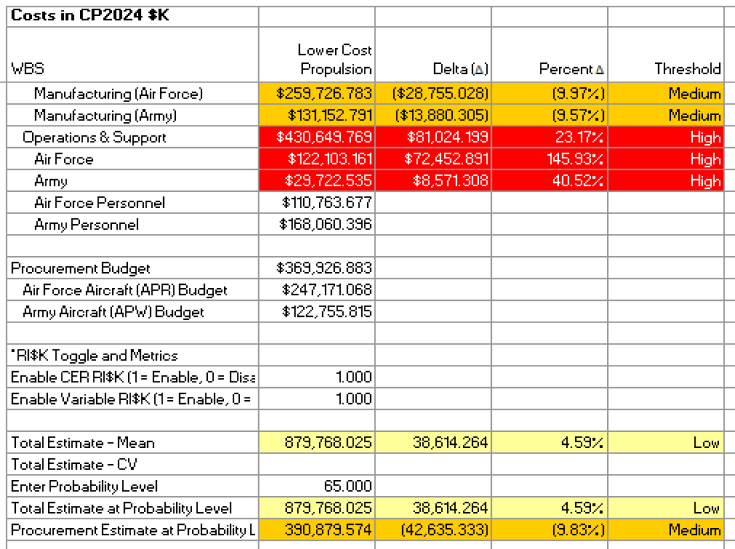
Example What-If Case:
- Tabular report highlighting differences in the model across various cases
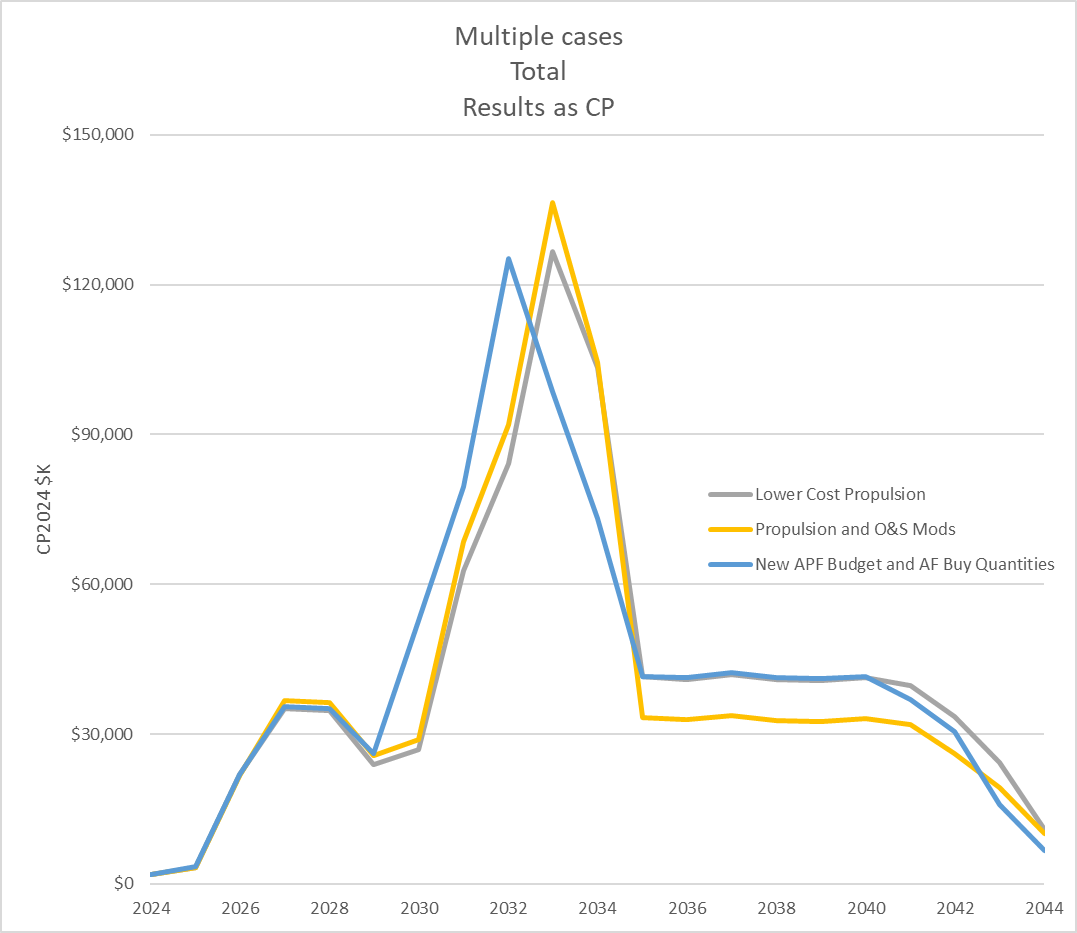
Example Phased Line Chart:
- Plot a single row's annual results from different cases
Quickly determine what the model is most sensitive to and which elements have the greatest influence on the cost and uncertainty results
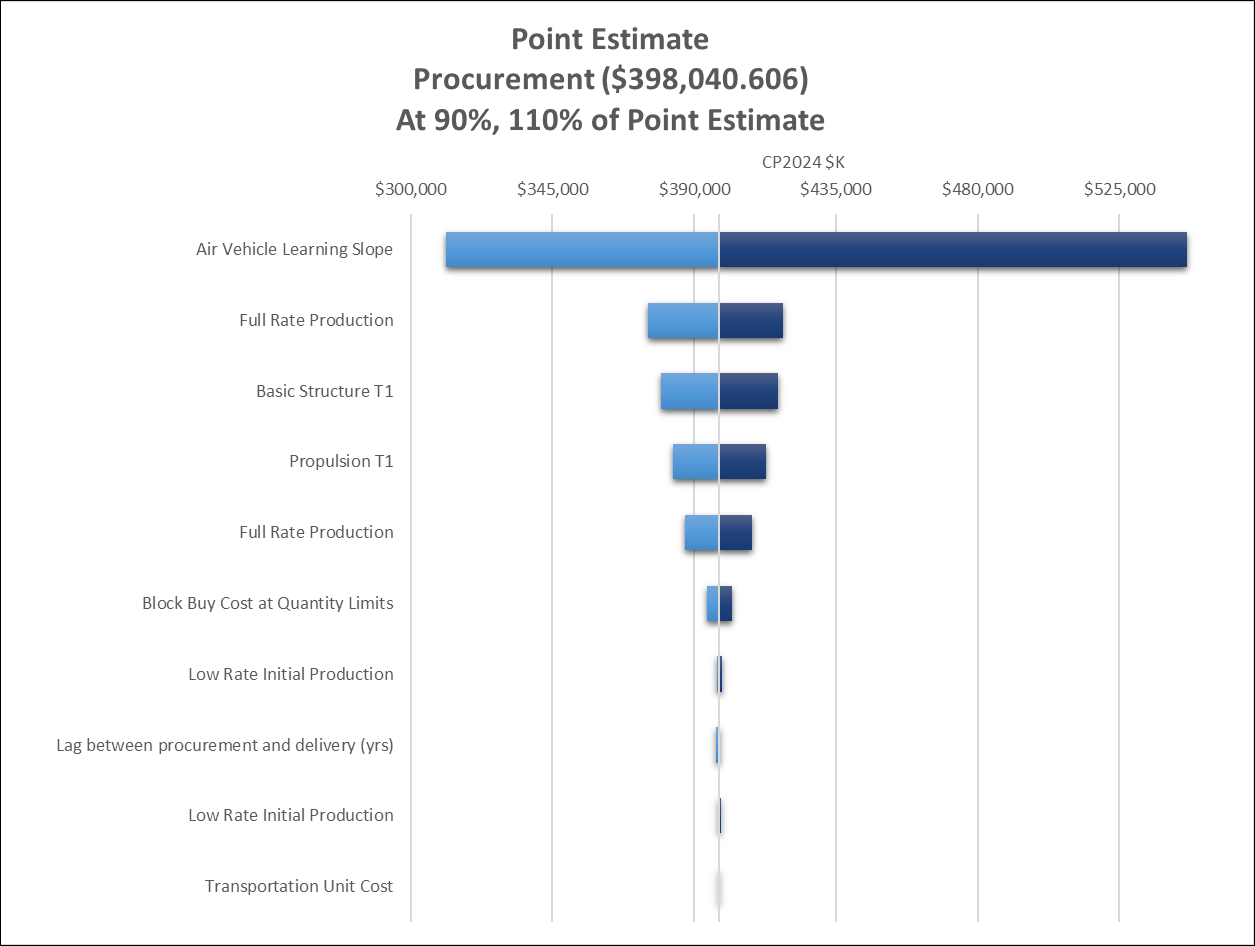
Example Tornado Chart:
- Individually adjust variables to measure their effect on the total
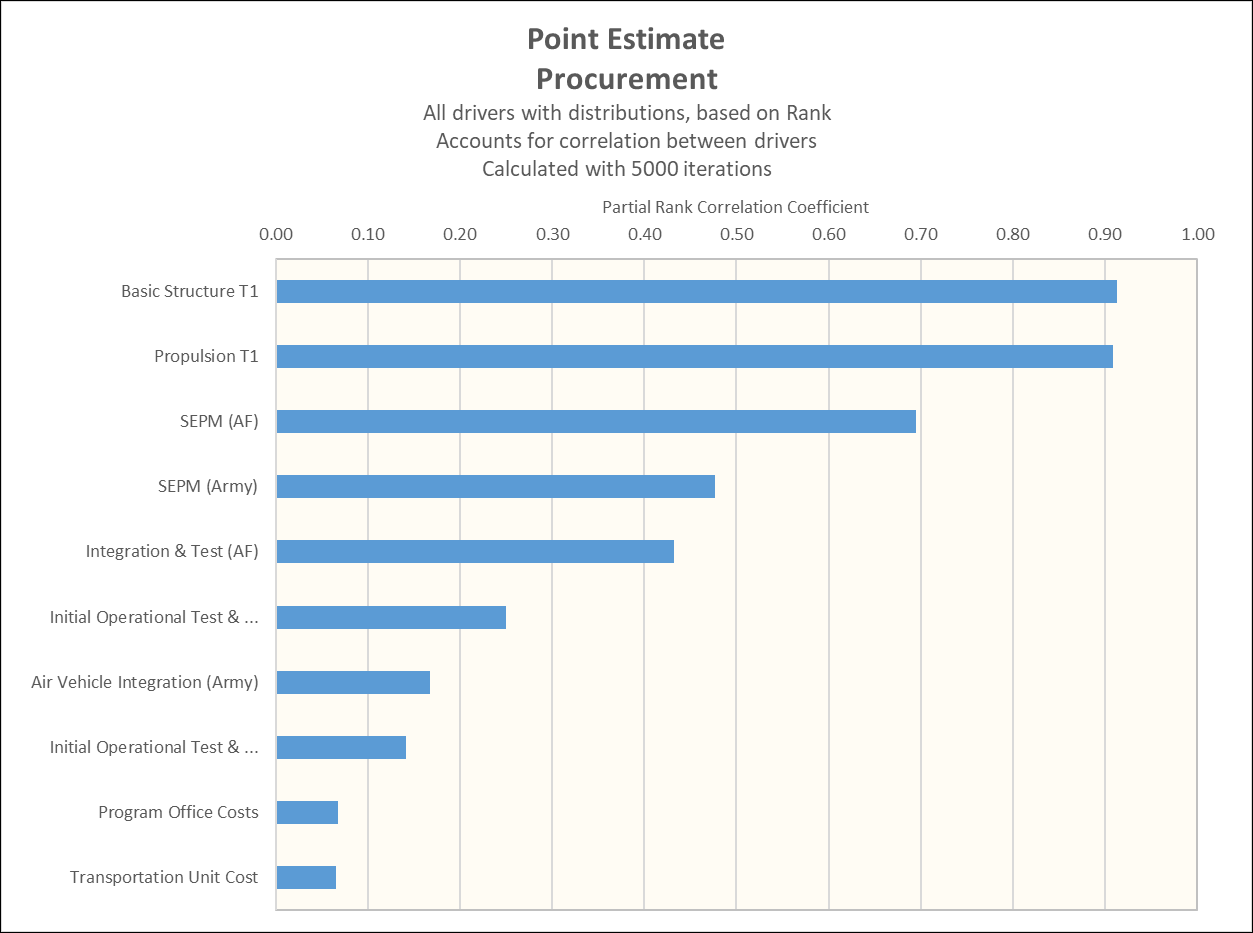
Example Variance Analysis Chart:
- Find elements contributing most to the total variance (uncertainty)
Explore the entire ACEIT Suite
eNewsletter 
Publication containing ACEIT tips, support alerts, upcoming classes, and more!
View the archive >